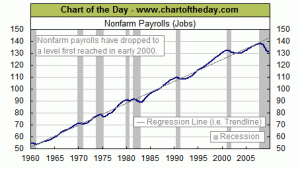
I posted earlier on what the shape of the recession/recovery might look like – more evidence today emerges that this could be a prolonged downturn: employment numbers. Here’s the first chart to consider:
 This reflects today’s release by the Labor Department that nonfarm payrolls decreased by 263,000. This puts the total number of jobs in the U.S. at a level equal to 2000 – thus 9.8% unemployment. Now here’s the second part of the puzzle:
 That drooping tail at the end shows the employment trend dropping sharply away from the 50-year trend line by a startling percentage.
The implications of this are simple: no jobs = no people spending money = no recovery. I reiterate from my earlier post – at least half of this, I believe, is policy driven. Employers are very reluctant to add workforce when they don’t know what their tax burden is going to be. What they do know is that the deficit has quadrupled in less than a year and that does not bode well for future taxation. They also know that Washington is dabbling with two humungous pieces of legislation that could dramatically affect the way we do business.
Again, I beg Washington to drop both of these pieces of legislation and immediately explore reductions of corporate tax rates and personal income tax rates to get this economy moving again. That prescription has proven time and time again to work.
Leave a comment